From Data to Decision: Using Real-Time Dashboards Effectively
A real-time dashboard can transform how you make decisions. Here's how to set it up and make the most of it.
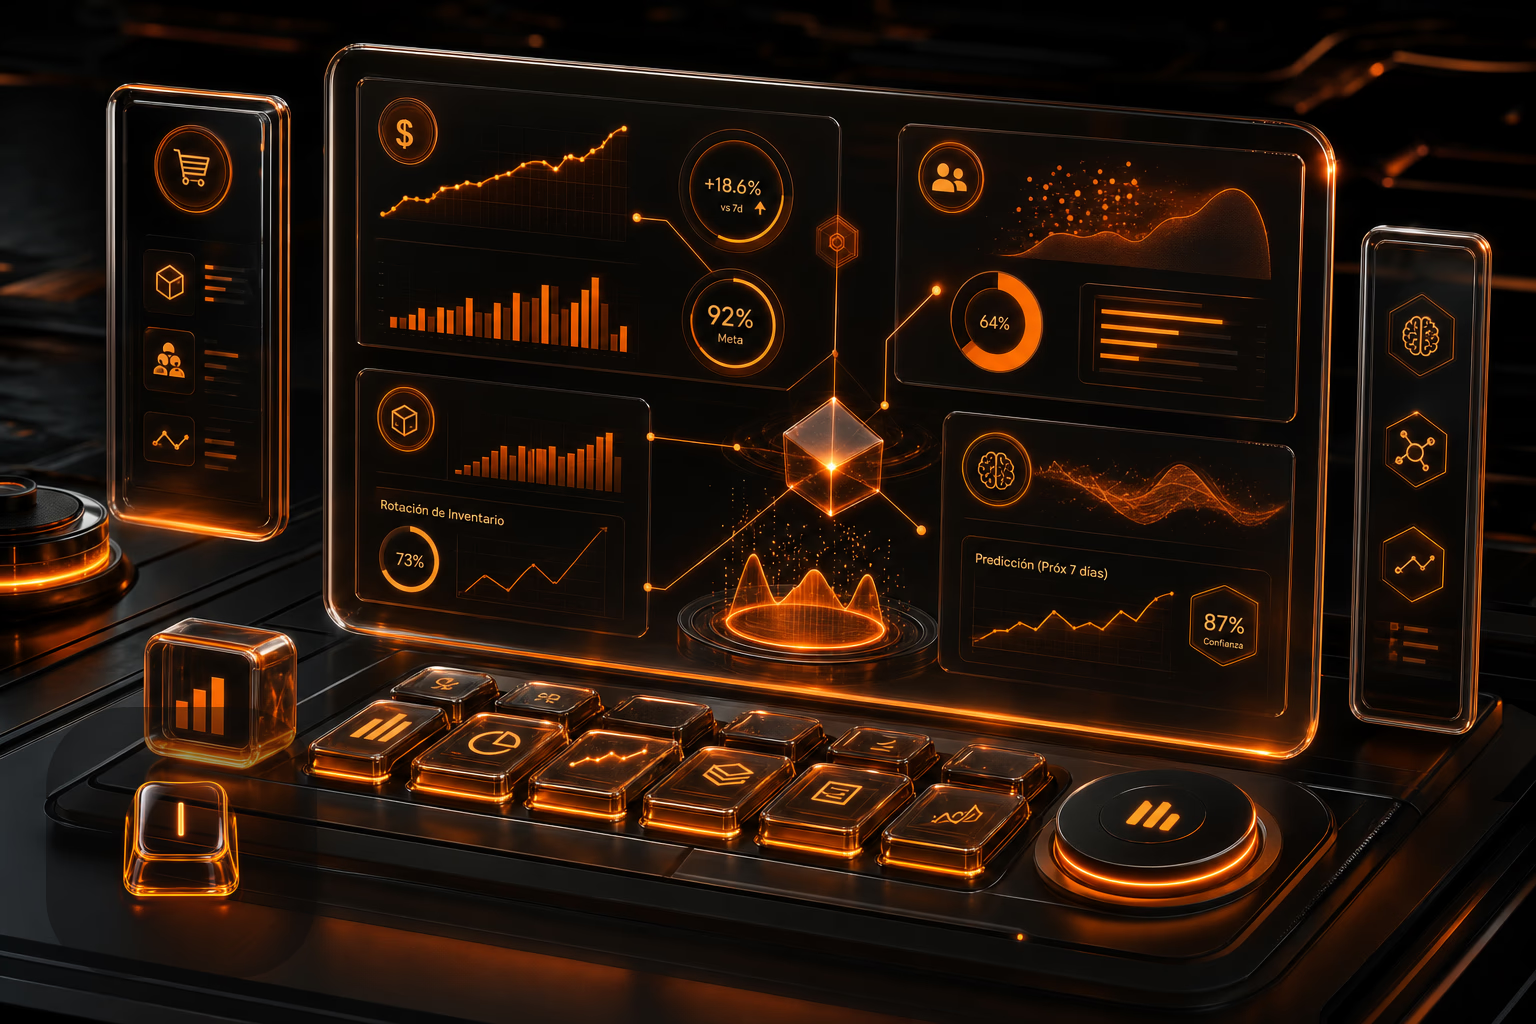
A real-time dashboard enables businesses to make informed decisions at the right moment, vital in the competitive retail industry.
What is a real-time dashboard?
What people ask us every week is if this is just a fancy report. It's not. A real-time dashboard connects directly to your data sources—sales, inventory, web traffic—and shows you what's happening *now*. Static reports tell you what happened last month; this tells you what to do in the next hour.
Which metrics should your dashboard include?
The metrics you track must be tied to a decision. For a retail business, we typically start with signals like average ticket size, sales velocity by category, and current stock levels. The goal isn't to admire charts; it's to answer questions like 'Should we run a flash sale on this product?' or 'Are we about to run out of our bestseller?'. Good data prevents bad surprises.
- Hourly or daily sales
- Inventory turnover
- Conversion rate
- Customer behavior (e.g., most searched products)
How to set up an effective dashboard?
Building a useful dashboard isn't about picking a tool like Power BI or Tableau. It's about the plumbing. We connect the right data sources, clean up the signals from the noise, and define the metrics that actually drive decisions. Anyone can drag and drop a chart, but making it reliable and integrated with your systems is where a technical team keeps you from getting burned by bad data.
A dashboard showing the wrong metrics is worse than no dashboard at all. It gives you the confidence to make the wrong call, faster.
What role does AI play in dashboards?
This is where we move from reporting to predicting. We use AI models to turn your dashboard from a rear-view mirror into a windshield. Instead of just showing you current stock levels, it can forecast demand and flag a likely stockout *next week*. This isn't magic; it's using your own historical data to build a statistical model that spots patterns and helps you act before a problem occurs.
| Functionality | Benefit |
|---|---|
| Sales prediction | Anticipate future demand and adjust inventory. |
| Automated alerts | Detect anomalies in real-time. |
| Customer segmentation | Provide personalized insights for campaigns. |
How much does it cost to implement a real-time dashboard?
What people assume is that this is a huge, multi-year project. It isn't. The cost depends entirely on the complexity of your data and the questions you need to answer. A simple dashboard using a tool like Google Data Studio can start under €1,000. Integrating predictive AI models might be in the €10,000 to €20,000 range. The key is that a well-built system pays for itself quickly by preventing just one major stockout or identifying one winning promotion.
What does this mean for your business?
Ultimately, a real-time dashboard is about closing the gap between data and decision. It's about giving your team the specific, reliable numbers they need to optimize inventory, adjust marketing spend, or change a price on the fly. You stop guessing and start operating based on what the data is telling you right now. If you're ready to build a system that drives decisions, not just reports, we should talk.
FAQ
What are the best tools for real-time dashboards?
Do I need technical skills to use a dashboard?
Also on Intellentia: what we do · our solutions · real cases
Read more: Power BI · Tableau · Google Data Studio
Keep reading: Using AI to Detect Fraud in Retail Transactions · Using Predictive Analytics for Inventory Planning · Using Prediction Models to Optimize Pricing in Retail · Using AI to Forecast Demand in Restaurants · Can AI Predict Customer Churn in Retail? Strategies for 2026